When I first started to set up Prometheus and Grafana to monitor MySQL and JVM, I found out a lot of tutorials but they were not good enough for a beginner like me. Some of them were outdated and the authors didn’t care to update the content. Other posts were too general and didn’t show me a clear path to proceed. Therefore, I tried to write a detailed tutorial on how to deploy Prometheus and Grafana using Docker to monitor MySQL and JVM. I created a Github repo which contains all the necessary files.
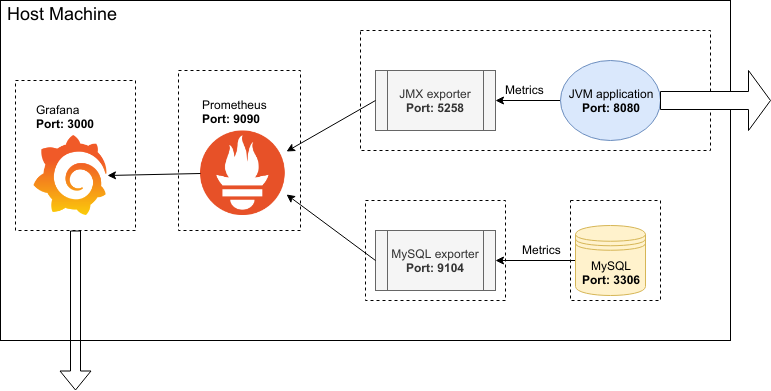
Architecture Overview

Dotted-line rectangle: A Docker container
JVM
Create a dummy Java server (in case you don’t have a Java running server yet) and use
JMX exporter to generate metrics for Prometheus (Replace SimpleServer to your main server).
Note that SimpleServer runs on port 8080.
-
Go to
jvmfolder. -
Run
wget https://repo1.maven.org/maven2/io/prometheus/jmx/jmx_prometheus_javaagent/0.11.0/jmx_prometheus_javaagent-0.11.0.jar -O jmx_exporter.jar -
Edit
jmx-config.yaml. -
docker build -t jmx-exporter . -
Run
docker run -d \
  -p 8080  \
  -p 5258  \
  --network test-network  \
  --name jmx-exporter \
  jmx-exporter
MySQL
- Create a dummy MySQL database (in case you don’t have a MySQL database) and use MySQL exporter to generate metrics for Prometheus.
  docker run -d \
    --name mysql \
    -p 3306 \
    --network test-network \
    --env MYSQL_ROOT_PASSWORD=mypassword \
    --volume mysql-datadir:/var/lib/mysql \
    mysql:8 \
    --default-authentication-plugin=mysql_native_password
- Create a specific user for the exporter.
-
docker exec -it mysql mysql -uroot -pand enter the password above -
Run the below commands in the MySQL Shell:
  CREATE USER 'exporter'@'%' IDENTIFIED BY 'password' WITH MAX_USER_CONNECTIONS 3;
  GRANT PROCESS, REPLICATION CLIENT, SELECT ON *.* TO 'exporter'@'%';
-
Exit the running MySQL container and run MySQL exporter (Replace the password of
exporterbelow).docker run -d \ --name mysql-exporter \ -p 9104 \ --network test-network \ --env DATA_SOURCE_NAME="exporter:password@(mysql:3306)/" \ prom/mysqld-exporter
Prometheus
-
Go to the root folder of the project to create a Prometheus container.
docker run -d \
  --name prometheus \
  -p 9090:9090  \
  --network test-network  \
  --restart unless-stopped  \
  --mount type=volume,src=prometheus-data,target=/prometheus \
  --mount type=bind,src="$(pwd)"/prometheus/prometheus.yml,target=/etc/prometheus/prometheus.yml  \
  prom/prometheus
Grafana
- Edit
grafana/grafana.inifile:
- Edit
smtpconfig. Adduserandpassword. - Follow this tutorial if you are using Gmail to send notifications.
-
Edit Dashboard, Data Source and Notifier settings in
grafana/provision. Editgrafana/provision/notifiers/notifier.yamlto add emails. -
Create a Grafana container.
docker run -d \
  -p 3000:3000 \
  --name grafana \
  --network test-network \
  --mount type=bind,src="$(pwd)"/grafana/grafana.ini,target=/etc/grafana/grafana.ini \
  --mount type=bind,src="$(pwd)"/grafana/provisioning,target=/etc/grafana/provisioning \
  grafana/grafana

